There are 13 divisions in the WFA: six in the National Conference (mostly eastern half of the country) and seven in the American Conference (mostly western). Some divisions’ winning teams have a first-round bye (i.e. they start playing in the second round of the playoffs) and for others, the winning team plays in the first round (either with or without automatic home field). Some divisions have the runner-up team also going to the playoffs; some don’t. Some divisions compete for two wildcard spots, some compete for one, and one has no wildcard bids at all. Yay!
While the WFA really only talks about two tiers (blue/stronger divisions and non-blue/less strong divisions) there are actually six tiers that a division can fall into. These range from the “best” (winning team has a bye, runner-up team plays first round, two possible wildcard spots) to the “worst” (winner has a first round game, no runner-up spot, competes for one possible wildcard spot). Here are the six tier structures, along with the divisions in each:
[table id=8 /]For a list of which teams are in which division (along with a notation of tier for each), check this puppy out.
[/toggle] [toggle title=”How are division winners determined?”]- The first criteria is in-division record.
- Should two teams have identical in-division records, head-to-head matches are compared.
- Should both teams have split their head-to-head games, point differential in head-to-head games is compared (with a cap of 40 points per game).
Let’s look at Division 2 as an example. DC has a regular season in-division record of 3-1, and so does Pittsburgh. They played two head-to-head matches and they each won one of them. However, the score of the game that DC won was 42 – 31 (a difference of 11 points) while the score of the game that PGH won was 36 – 27 (a difference of 9 points). DC had the greater point differential so they are the division champs and PGH are the runners-up.
To my knowledge, overall record is not used at all in determining division winners. Confusion about this is understandable, though, considering the WFA’s own standings page goes by overall record (which doesn’t matter for determining division winners) and also lists in-conference record (which also doesn’t matter) but does NOT list in-division record at all (which IS actually what counts). Go figure. You can see division record here, if you want.
It’s worth noting that teams throughout the WFA do not all play the same number of in-division games in a season. This means it’s entirely possible to have a scenario where you’re trying to compare an uneven number of games; this almost happened in Division 8 this year. Going into the last week of regular season play, the KC Titans had an in-division record of 5-0 and the St. Louis Slam were 5-1. Those two teams were scheduled to play each other in their week 10 game. Had St. Louis won, that would have given them an effective record of 6-1 to KC’s 5-1. The only way I know to compare records of uneven numbers is winning percentage, which would have been 0.833 for KC and 0.857 for St. Louis, making St. Louis the division champion – even though KC would very likely have been 6-1 as well if they had had the opportunity to play another in-division game! Ugly. And irrelevant here, as KC won, but if all of this stays the same, it’s just a matter of time before this plays out for real.
[/toggle]
[toggle title=”How are wild card teams determined?”]
Once you’ve taken out your division winners and runners-up, it’s time to figure out your wild cards. Here’s how:
- Who’s got the better overall record? (Division record is irrelevant here.)
- If two teams have identical overall records, the next factor is head-to-head matchups, with point differential (as in the example for division winners above) if needed.
- If they didn’t play each other at all, the next factor is games against common opponents, going to point differential if the outcomes are tied.
Here’s how this went for the wild card spot in Divs 10, 11, 12 and 13:
Once you take out all the winners and runners-up, the best overall record was a tie between the Portland Fighting Fillies and the Las Vegas Showgirlz [sic], both of whom were at 5-3. Their only common opponent was the Utah Blitz; here are their games:
Portland FF (33) @ Utah Blitz (14)
Las Vegas (40) @ Utah Blitz (2)
Las Vegas (49) vs. Utah Blitz (0)
Since there’s an uneven number of games, you compare the games played at the same location (i.e. home or away). Portland played away, so you look at Las Vegas’ away game. Portland’s point differential was 19 to Las Vegas’ 38, so the latter is the wild card team.
[/toggle]
[toggle title=”How is home field determined?”]Oh, it’s really simple! Check it out:
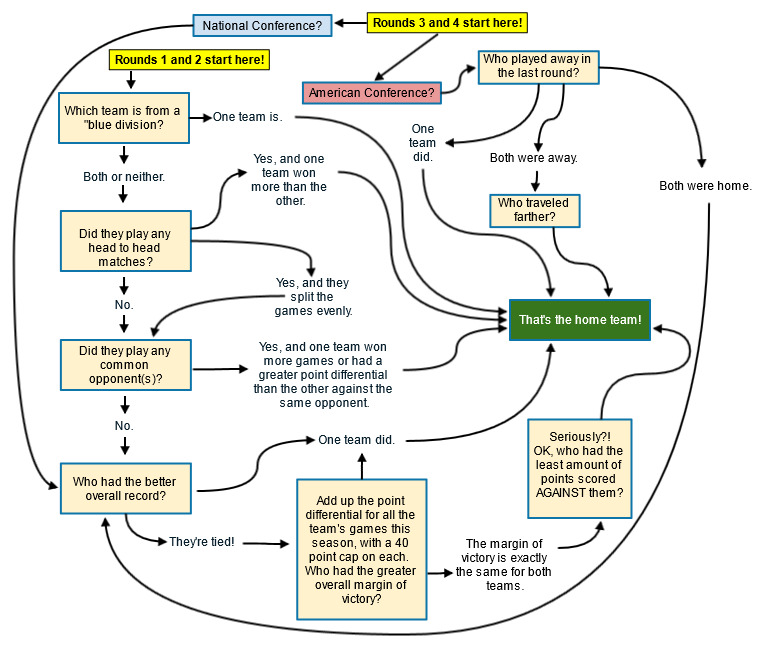
Incidentally, I have a little spreadsheet set up that lets me figure out who is likely to have home field in upcoming games; if you’re curious about any particular potential matchup, lemme know and I’ll tell you if there’s enough info to determine it.
[/toggle]
[toggle title=”How do you have time to put all this playoff stuff together?”]I don’t sleep.[/toggle]
[toggle title=”Aren’t you tired?”]Yes.[/toggle]
[/five_sixth_last]